This article provides an overview of candlestick patterns, emphasizing their importance in understanding price movements in trading. It highlights the significance of knowing various candlestick patterns, which can aid beginner traders in improving their trading skills.
Candlestick patterns offer visual representations of supply and demand dynamics in the market, applicable in both bullish and bearish conditions.
We'll discuss candlestick patterns and their use in technical analysis.
Some key points:
- Candlestick patterns provide a visual representation of supply and demand forces on stock prices through their open, high, low and close values over time.
- Traders use different candlestick patterns found in bullish and bearish markets to identify trading opportunities.
- Candlestick patterns have been widely used by Japanese traders since the 17th century because they effectively showcase market participant emotions and sentiment.
- Patterns are formed by plotting stock price data as candlesticks, with bodies and wicks showing opening, closing, high and low prices.
- Traders make decisions by identifying repeating candlestick patterns in market behavior.
- Candlestick patterns are an effective tool for reading price charts because they represent market sentiment well. Beginner traders can also benefit from their ease of use and interpretation.
Bullish Reversal Patterns:
Bullish reversal patterns on candlestick charts signal a potential transition from a downtrend to an uptrend, indicating that buyers are beginning to take control of the market. In this article, we will explore the 13 most commonly used bullish reversal patterns in candlestick analysis.
| Pattern Name | Description |
Bullish Engulfing
| - Pattern Class: Two Candles Pattern.
- Pattern Signal: Bullish Reversal.
- Formation: A lower open followed by a higher close, engulfing the previous candle.
- Psychology Behind Formation: Indicates strong buyer interest overcoming initial selling pressure.
- Market Sentiment Shift: Signals a transition from bearish to bullish sentiment.
- Trading Opportunity: Provides a signal for traders to consider long positions.
- Predictive Accuracy: Has a 65% success rate in forecasting price increases.
|
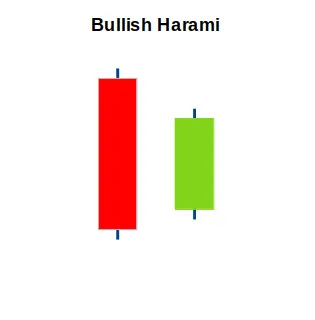
Bullish Harami
| - Pattern Class: Two Candles Pattern.
- Pattern Signal: Bullish Reversal.
- Formation: Bullish harami pattern shows a small bullish candle within a larger bearish candle.
- Psychology Behind Formation: Indicates market confusion; declining selling pressure with emerging buyer control.
- Market Sentiment Shift: Signals potential transition from bearish to bullish sentiment.
- Trading Opportunity: Identifies possible reversal points for buying decisions.
- Predictive Accuracy: Approximately 54% success rate in forecasting market reversals.
|
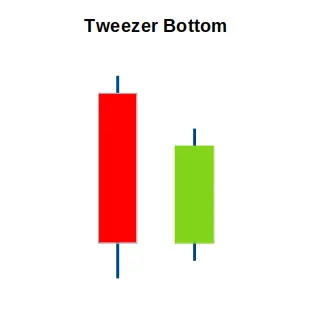
Tweezer Bottom
| - Pattern Class: Two Candles Pattern.
- Pattern Signal: Bullish Reversal.
- Formation: Tweezer bottom pattern consists of two or more candles with equal lows.
- Psychology Behind Formation: Reflects buyer strength and seller weakness at support level.
- Market Sentiment Shift: Indicates potential shift from bearish to bullish momentum.
- Trading Opportunity: Serves as a strong bullish signal for traders to buy.
- Predictive Accuracy: Approximately 61% success rate in forecasting bullish reversals.
|
Morning Star
| - Pattern Class: Three Candles Pattern.
- Pattern Signal: Bullish Reversal.
- Formation: Morning star pattern consists of three candles: bearish, small (doji), bullish.
- Psychology Behind Formation: Indicates market indecision; sellers losing strength, buyers gaining momentum.
- Market Sentiment Shift: Signals potential reversal from bearish to bullish trend.
- Trading Opportunity: Traders set stop losses below doji or bullish candle for safety.
- Predictive Accuracy: Approximately 65% success rate in predicting bullish reversals.
|
Morning Star Doji
| - Pattern Class: Three Candles Pattern.
- Pattern Signal: Bullish Reversal.
- Formation: Morning star doji consists of a bearish candle, a doji, and a bullish candle.
- Psychology Behind Formation: Indicates indecision; bears losing strength as buyers emerge.
- Market Sentiment Shift: Signals potential reversal from bearish to bullish trend.
- Trading Opportunity: Traders look for bullish confirmation above the doji's midpoint.
- Predictive Accuracy: Approximately 68% success rate in forecasting bullish reversals.
|
Bullish Abandoned Baby
| - Pattern Class: Three Candles Pattern.
- Pattern Signal: Bullish Reversal.
- Formation: Bullish abandoned baby consists of a bearish candle, a doji, and a bullish candle.
- Psychology Behind Formation: Indicates diminishing selling pressure and emerging bullish sentiment.
- Market Sentiment Shift: Signals a transition from bearish to bullish market conditions.
- Trading Opportunity: Traders look for bullish confirmation after the doji gap up.
- Predictive Accuracy: Approximately 66% success rate in predicting bullish reversals.
|
Three Outside Up
| - Pattern Class: Three Candles Pattern.
- Pattern Signal: Bullish Reversal.
- Formation: Three outside up consists of a bearish candle followed by two bullish candles.
- Psychology Behind Formation: Indicates bears' defeat and emerging bullish momentum.
- Market Sentiment Shift: Signals potential reversal from bearish to bullish trend.
- Trading Opportunity: Traders anticipate upward movement after the pattern confirms.
- Predictive Accuracy: Approximately 70% success rate in forecasting bullish reversals.
|
Three Inside Up
| - Pattern Class: Three Candles Pattern.
- Pattern Signal: Bullish Reversal.
- Formation: Three inside-up consists of a bearish candle followed by two bullish candles.
- Psychology Behind Formation: Reflects bears losing control as buyers gain strength.
- Market Sentiment Shift: Signals transition from bearish to bullish market conditions.
- Trading Opportunity: Traders anticipate buying after the strong bullish confirmation.
- Predictive Accuracy: Approximately 64% success rate in forecasting bullish reversals.
|
| Bullish Kicker
| - Pattern Class: Two Candles Pattern.
- Pattern Signal: Bullish Reversal.
- Formation: Bullish kicker consists of a bearish candle followed by a strong bullish candle.
- Psychology Behind Formation: Indicates strong buying interest overcoming previous selling pressure.
- Market Sentiment Shift: Signals a significant transition from bearish to bullish sentiment.
- Trading Opportunity: Traders look for bullish confirmation after the gap up.
- Predictive Accuracy: Approximately 68% success rate in forecasting bullish reversals.
|
Piercing Line
| - Pattern Class: Two Candles Pattern.
- Pattern Signal: Bullish Reversal.
- Formation: Piercing line consists of a bullish candle opening below and closing above the previous candle's midpoint.
- Psychology Behind Formation: Indicates strong buying interest overcoming prior selling pressure.
- Market Sentiment Shift: Signals a potential reversal from bearish to bullish market conditions.
- Trading Opportunity: Traders anticipate buying after confirmation of the bullish candle.
- Predictive Accuracy: Approximately 60% success rate in forecasting bullish reversals.
|
| Hammer
| - Pattern Class: One Candle Pattern.
- Pattern Signal: Bullish Reversal.
- Formation: Hammer pattern features a small body and a long lower wick.
- Psychology Behind Formation: Reflects buyers regaining control after sellers' initial push.
- Market Sentiment Shift: Suggests potential reversal from bearish to bullish sentiment.
- Trading Opportunity: Traders look for confirmation after the hammer's appearance.
- Predictive Accuracy: Approximately 62% success rate in forecasting bullish reversals.
|
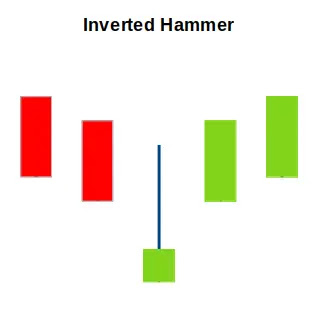
Inverted Hammer
| - Pattern Class: One Candle Pattern.
- Pattern Signal: Bullish Reversal.
- Formation: Inverted hammer features a small body and a long upper shadow.
- Psychology Behind Formation: Indicates bullish buying pressure after seller exhaustion.
- Market Sentiment Shift: Suggests potential reversal or continuation of bullish trend.
- Trading Opportunity: Traders seek confirmation following the inverted hammer's appearance.
- Predictive Accuracy: Approximately 65% success rate in forecasting bullish reversals.
|
Three White Soldiers
| - Pattern Class: Three Candles Pattern.
- Pattern Signal: Bullish Reversal.
- Formation: Three white soldiers consist of three consecutive bullish candles with higher closes.
- Psychology Behind Formation: Reflects a shift from bearish pessimism to bullish optimism.
- Market Sentiment Shift: Signals potential reversal after a bearish decline.
- Trading Opportunity: Traders may buy following confirmation of this pattern.
- Predictive Accuracy: Approximately 82% success rate in forecasting bullish reversals.
|
Summary and Conclusion
Bullish candlestick patterns serve as important signals for traders, indicating potential reversals in price trends from bearish to bullish. By recognizing these patterns, traders can identify opportunities to enter long positions, capitalize on upward momentum, and enhance their overall trading strategies. These patterns often emerge after downtrends and reflect a shift in market sentiment, suggesting that buyers are gaining strength and control.
In conclusion, mastering bullish candlestick patterns equips traders with the tools needed to anticipate market movements effectively. These patterns not only provide insights into potential price increases but also foster a proactive approach to trading. By integrating bullish candlestick patterns into their analyses, traders can make informed decisions, seize profitable opportunities, and ultimately improve their trading performance in the dynamic financial markets.